ARROW FINANCIAL (AROW)·Q4 2025 Earnings Summary
Arrow Financial Posts Record Quarter as EPS Soars 215% YoY
January 29, 2026 · by Fintool AI Agent
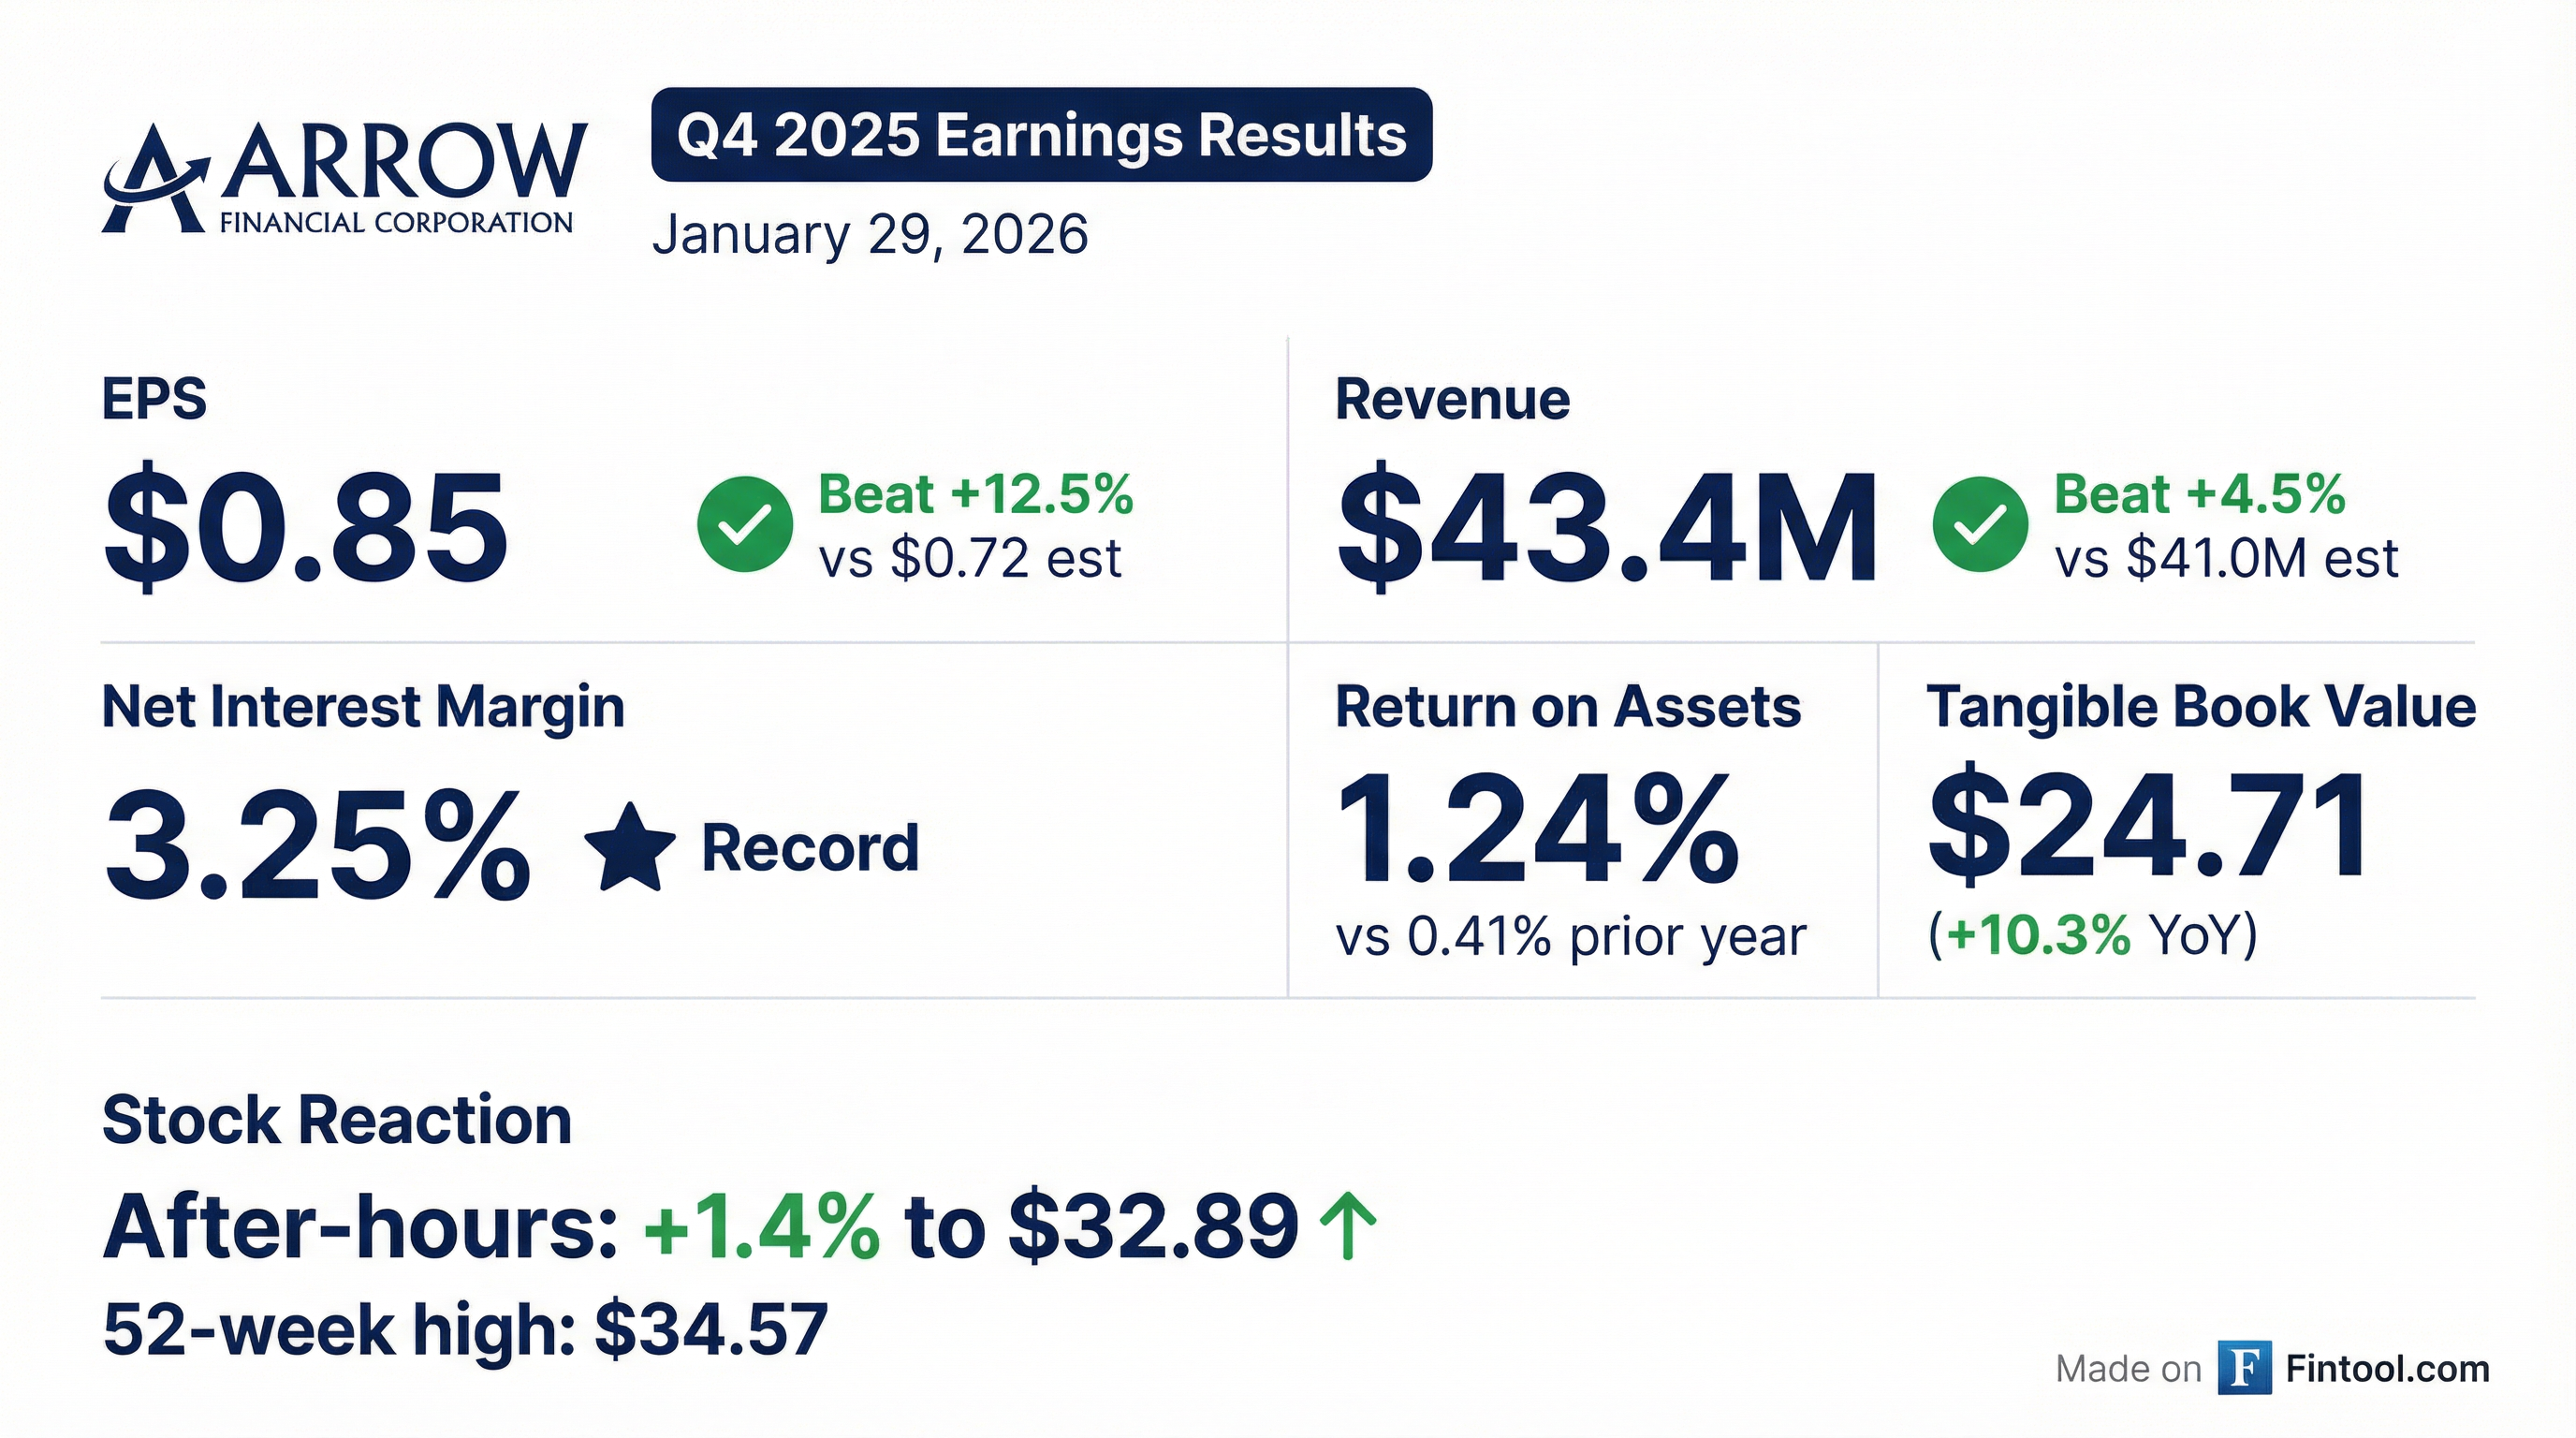
Arrow Financial Corporation (NASDAQ: AROW) delivered record Q4 2025 results, with EPS of $0.85 crushing both consensus of $0.72 and the year-ago $0.27 by a wide margin. The regional bank's full-year EPS of $2.65 represents a 50% increase over 2024's $1.77, driven by aggressive net interest margin expansion and disciplined expense management.
The stock is up 1.8% to $33.00 in regular trading following the announcement, hitting its highest level since mid-December.
Did Arrow Financial Beat Earnings?
Yes — convincingly. Arrow beat on both EPS and revenue:
*Values retrieved from S&P Global
This marks Arrow's third consecutive quarterly beat after a challenging stretch in early 2024-2025. The turnaround has been dramatic:
*Values retrieved from S&P Global
What Drove the Record Quarter?
Net Interest Margin Hits All-Time High
The standout metric: 3.25% FTE net interest margin, a record for the company. This compares to 3.19% for full-year 2025 — reflecting continued sequential improvement throughout the year.
The margin expansion was driven by:
- Loan repricing — Average loan yield of 5.42% with Q4 originations at higher rates than portfolio exit rates
- Deposit cost discipline — Retail deposit rates decreased 8bps to 1.60% in Q4
- Mix improvement — Business deposits growing as a share of total, municipal deposits declining
CEO David DeMarco highlighted the strong finish: "Record 4Q25 Net Income of $14.0 million, or $0.85 EPS" with the quarter completing the unification project.
Full Year 2025 Performance
*Values retrieved from S&P Global
How Did the Stock React?
AROW is up 1.8% to $33.00 following the earnings release, hitting its highest level since mid-December. The stock has been on a tear, up 45% from its 52-week low of $22.72.
What Changed From Last Quarter?
Key quarter-over-quarter changes (Q4 vs Q3 2025):
*Values retrieved from S&P Global
Notable changes:
- Tax strategies implemented in Q4 lowered the effective tax rate, adding ~9bps to ROA
- Unification project (merger of subsidiary banks into Arrow Bank) completed — no more related expenses
- Efficiency ratio dropped below 60% for the first time, showing operating leverage
Efficiency Ratio Progression:
The trend shows consistent quarterly improvement as Arrow generates positive operating leverage. Excluding unification expenses, the 2025 full-year efficiency ratio would be 60.6%.
Balance Sheet Highlights
Credit quality remains pristine:
- Nonperforming loans: 0.24% of total loans ($8.5M)
- Net charge-offs: 0.08% annualized for Q4
- Allowance coverage: 406% of nonperforming loans
Loan Portfolio Quality
Arrow's underwriting discipline shows in its portfolio metrics:
Consumer Auto Loans:
- Sourced through network of >510 dealers in NY and VT
-
75% of balances have FICO scores >700; <4% below 620
- Average FICO: 742 | Average DTI: ~31% | Average LTV: 87%
- Mix: ~28% new vehicles, ~72% used
- Portfolio turns in <36 months (~$40M/month)
Commercial Real Estate (CRE):
- CRE concentration: ~130% of risk-based capital
- No exposure to large metro areas (e.g., NYC)
- Non-owner occupied Office: <7% of CRE, ~1% of total loans
- Non-owner occupied Retail: ~13% of CRE, ~2% of total loans
- Hotels/Motels: ~26% of CRE, <5% of total loans
Deposit Composition
Favorable mix shift toward business deposits:
Retail deposit rates decreased 8bps from 1.68% to 1.60% in Q4, with rate cuts implemented in November and December.
Capital Return
Arrow continues its shareholder-friendly capital allocation:
Dividend:
- Q1 2026 dividend declared: $0.30/share
- 49th consecutive quarter of dividends
- ~3.6% annualized yield at current prices
Buybacks:
- $9.9M of shares repurchased in 2025
- ~377,500 shares at average price of $26.32
- $5.1M remaining under current authorization
Insider Buying:
- Management and Directors added
27K shares ($750K) in 2H 2025 - Management owns ~0.6%, Directors ~1.4%, Employees ~5.2% (via ESOP, ESPP, equity incentives)
Capital ratios remain well above "well capitalized" thresholds:
- CET1 Ratio: 13.10%
- Total Risk-Based Capital: 14.86%
- Tangible Common Equity: 9.19%
What Did Management Say About 2026?
Arrow enters 2026 celebrating its 175th anniversary, with strong momentum from the record quarter:
Key forward-looking commentary:
- NIM expansion expected to continue in 2026 (excluding FRB rate cuts)
- NIM expansion increasingly driven by lower deposit pricing vs loan repricing
- Post-unification cost savings to benefit operating expenses
- Future Fed rate cuts would accelerate NIM expansion further
- Generating positive operating leverage with efficiency trending below 60%
The slide presentation noted that 2025 saw "strong growth in EPS, ROA, NIM and TBV" and positioned the company as "well positioned for 2026."
Risks and Concerns
Items to monitor:
- Municipal deposit seasonality — Elevated municipal deposits in Q3 negatively impacted NIM by 4bps; this will continue to create quarterly volatility
- Delinquency uptick — Q4 delinquencies rose to 0.84% of loans (seasonal pattern), including one $2.6M commercial loan expected to pay off in Q1 2026
- Credit normalization — While pristine now, net charge-offs increased to 0.19% for full year (vs 0.09% in 2024) due to one commercial relationship
- Rate sensitivity — Further Fed cuts could eventually compress yields faster than deposits reprice
Key Takeaways
- Record quarter — $0.85 EPS beat consensus by 18%, driven by record 3.25% NIM
- Full-year transformation — 50% EPS growth ($2.65 vs $1.77) shows successful execution
- Operating leverage — Efficiency ratio improved from 68.8% (2023) to 59.0% (Q4 2025), unification complete
- Strong underwriting — Auto loan portfolio has 742 average FICO; CRE has no NYC exposure
- Capital return — Dividend at $0.30/share, insiders buying, buybacks ongoing
The bottom line: Arrow Financial delivered a blowout quarter that validates its strategic repositioning. The NIM expansion story has further room to run, and with the bank merger integration complete and strong loan portfolio quality, 2026 should see cleaner earnings growth with positive operating leverage.
Data sources: Arrow Financial 8-K filed January 29, 2026; Q4 2025 Investor Presentation; S&P Global estimates